Purpose
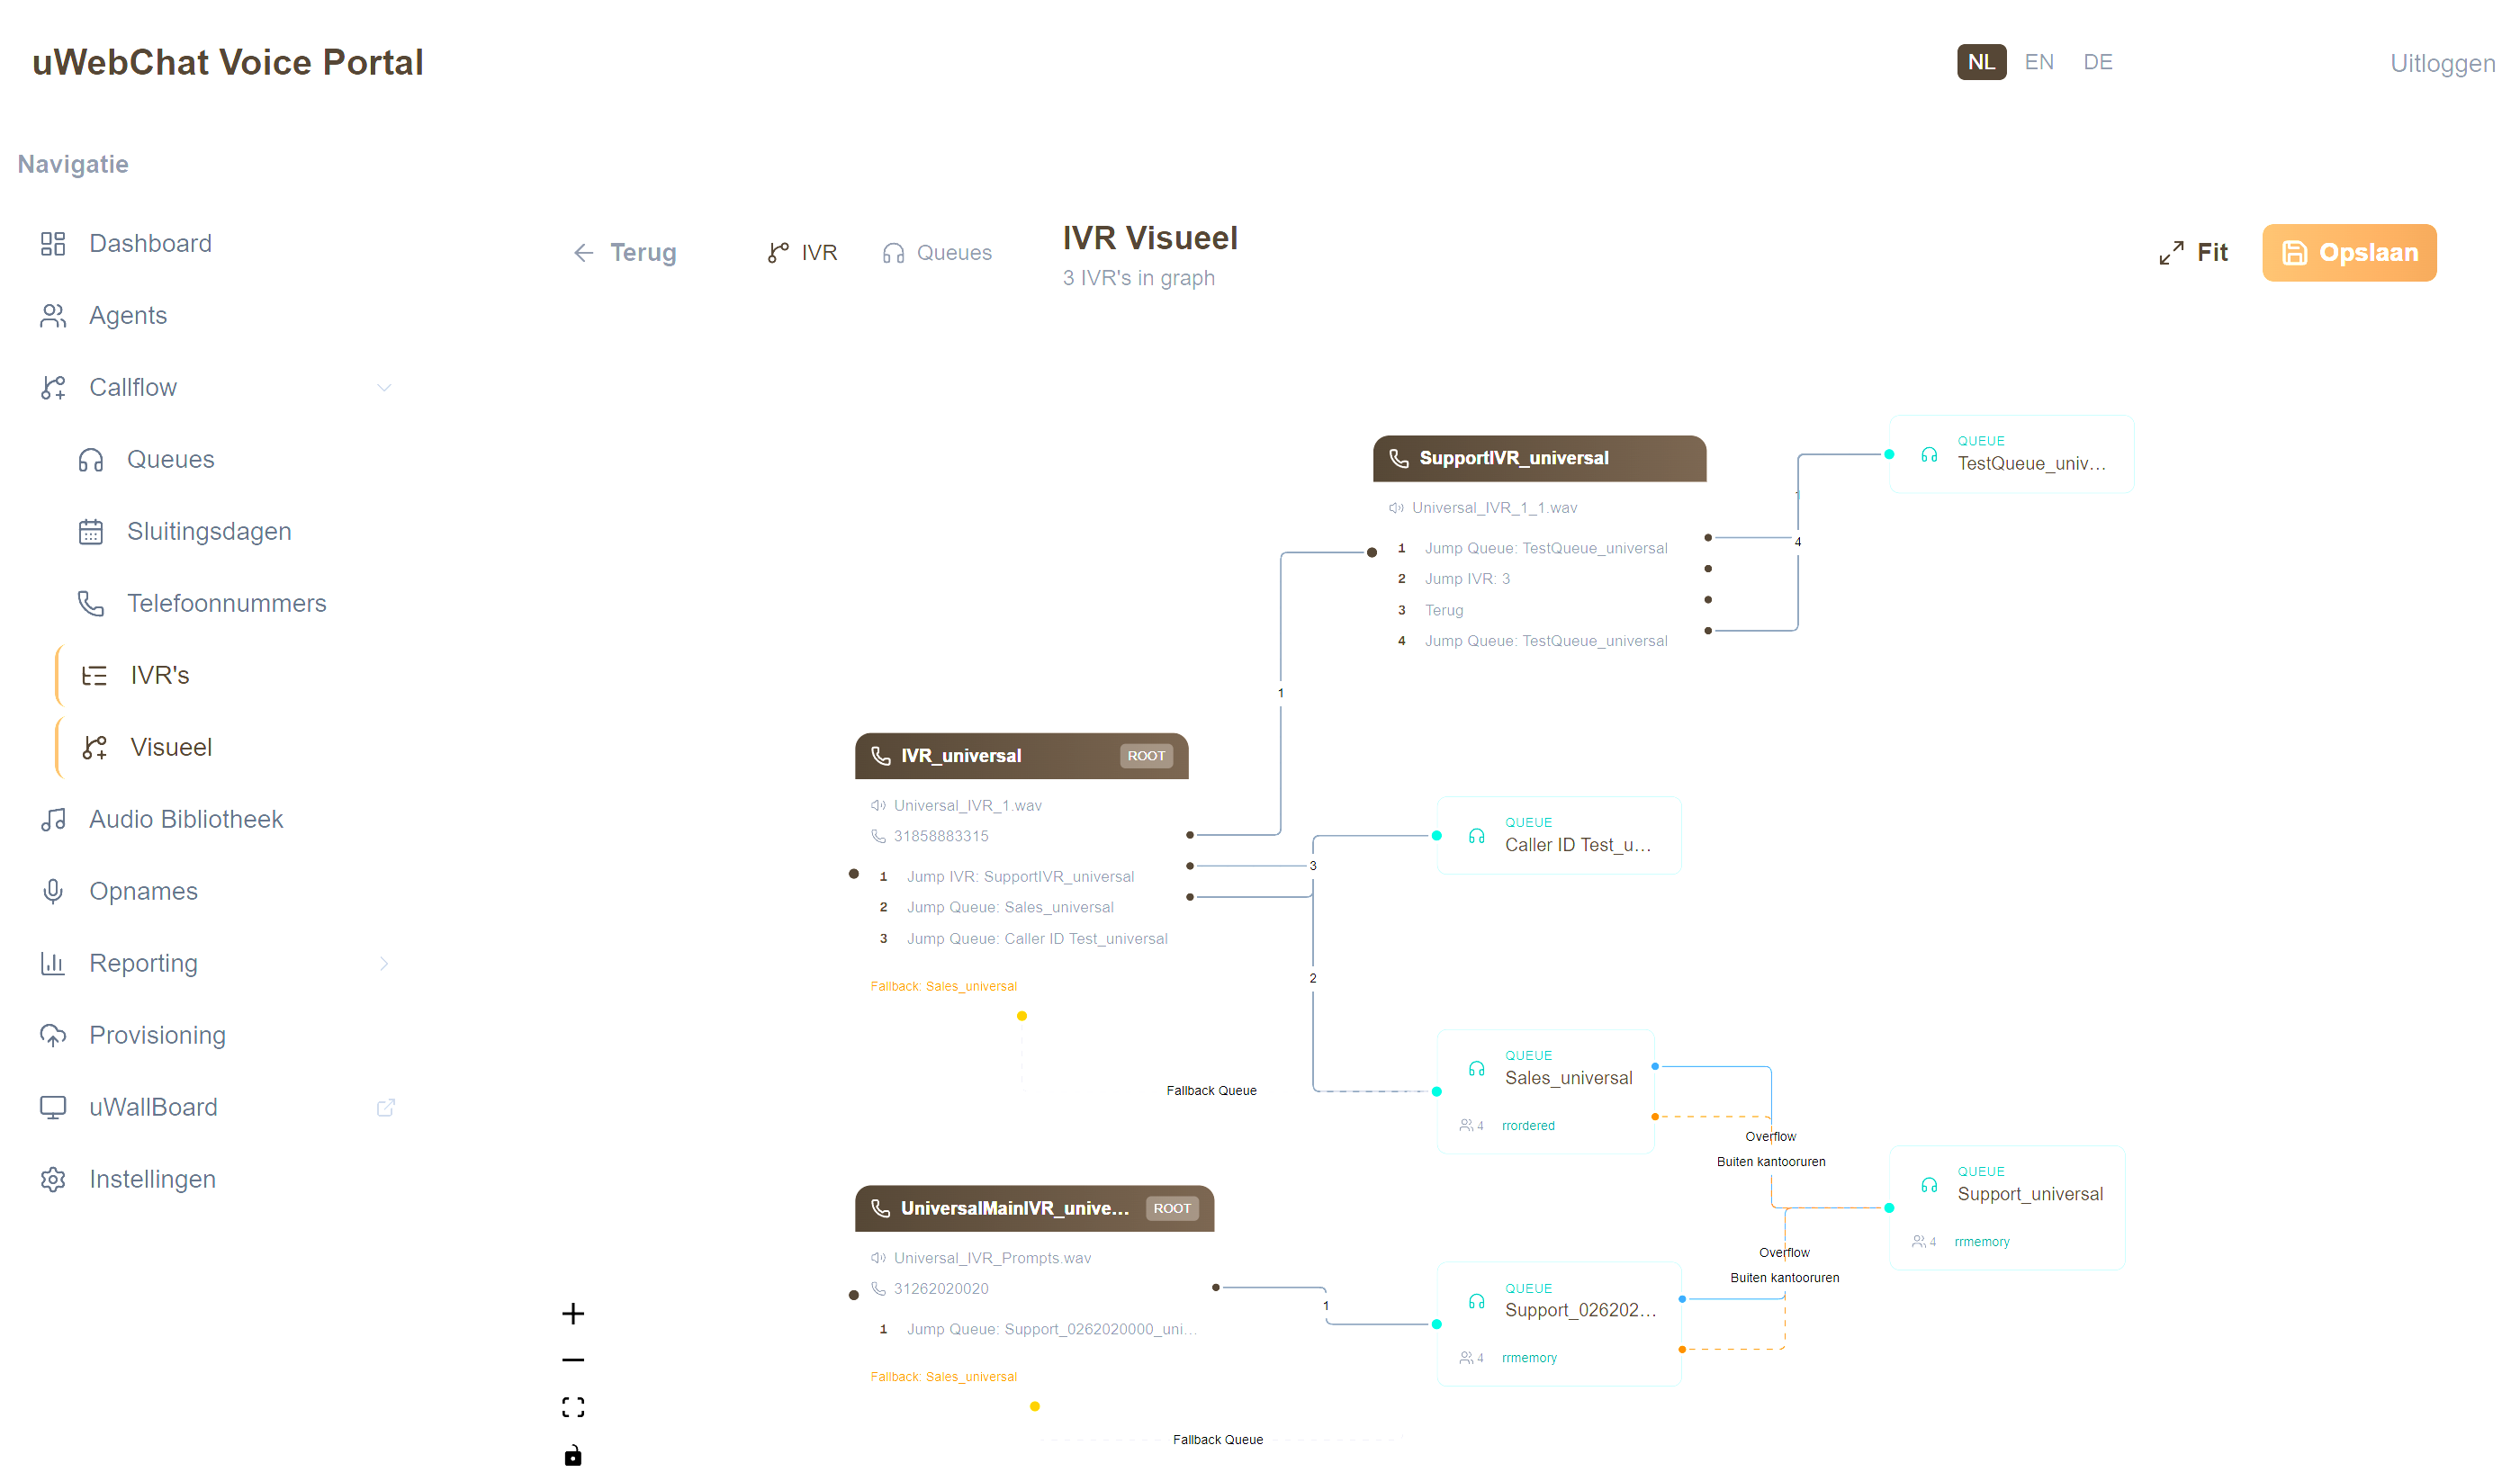
Visual is an interactive diagram that shows your complete call flow as a network of nodes: phone numbers, IVR menus, queues and agents — and how they connect.
Use this view to:
- See at a glance where incoming calls go
- Spot unintended loops (circular references)
- Walk a new colleague through "how a sales call flows here"
- Support supervision and compliance audits
Required permissions: UWEBCHATVOICE.IVR.VIEW (for IVR mode) and/or UWEBCHATVOICE.QUEUES.VIEW (for queue mode).
5.6.1 Two display modes
At the top of the screen you find a toolbar with a toggle:
| Mode | What it shows |
|---|---|
| IVR | All main and sub-IVRs, their menu options and forwarding to queues. Starting point: incoming DIDs. |
| Queue | All queues and the agents linked to them. Optionally filter by a specific phone number. |
Click the toggle button to switch. The diagram recalculates automatically.
5.6.2 Diagram nodes
The diagram contains four types of nodes, each with its own colour code:
| Node type | Shows |
|---|---|
| IvrNode | An IVR menu with its key options (1, 2, 3, …) |
| IvrRefNode | A reference to another IVR (sub-menu) |
| QueueNode | A queue with member count, strategy, linked number |
| AgentNode | An individual agent (queue mode only) |
Nodes are arranged left-to-right: on the left the incoming number or root IVR, on the right the final destination (agent or catch-all queue).
5.6.3 Navigation and interaction
- Scroll or pinch → zoom in/out
- Click and drag on the background → pan
- Click a node → highlights incoming/outgoing connections
- Filter field in toolbar → search by phone number (queue mode)
The canvas is read-only: you cannot move nodes or create connections. Changes to IVR options, queue links or agent assignments are made in their respective management screens (§5.5, §5.1, §4).
5.6.4 Jump to Visual from an IVR
From the IVR list (§5.5.1) the eye icon takes you straight to a focused version of the diagram that shows only that one IVR and its direct surroundings.
Pitfalls
- Empty diagram — no IVRs or queues configured. Create a queue (§5.1) or IVR (§5.5) first.
- Diagram loads slowly — with very many nodes (1000+ entities) the first render can take a few seconds.
- Nodes overlap — with unusual flow structures the auto-layout can be suboptimal. Refresh the page or switch view mode briefly to trigger a recalc.