Purpose
Get insight into call-center performance per day, week or month. Compare queues, agents and call volumes; spot peaks; check SLA targets.
Required permissions: UWEBCHATVOICE.REPORTING.VIEW. For the Call Summary tab additionally: UWEBCHATVOICE.CDR.VIEW.
8.2.1 Three tabs
The Reports page has three tabs:
- Overview — KPIs, SLA gauges, charts and summary tables
- Presence — historical agent presence report (Teams status over time)
- Call Summary — paginated call list with drill-through to the complete call flow (replaces earlier Power BI reporting)
8.2.2 Filters
At the top of every tab you find:
- Date Range (from/to)
- Preset buttons — Today, This week, This month (highlighted yellow when active)
- Queue selector — one or more queues
- Agent selector — one or more agents
8.2.3 "Overview" tab
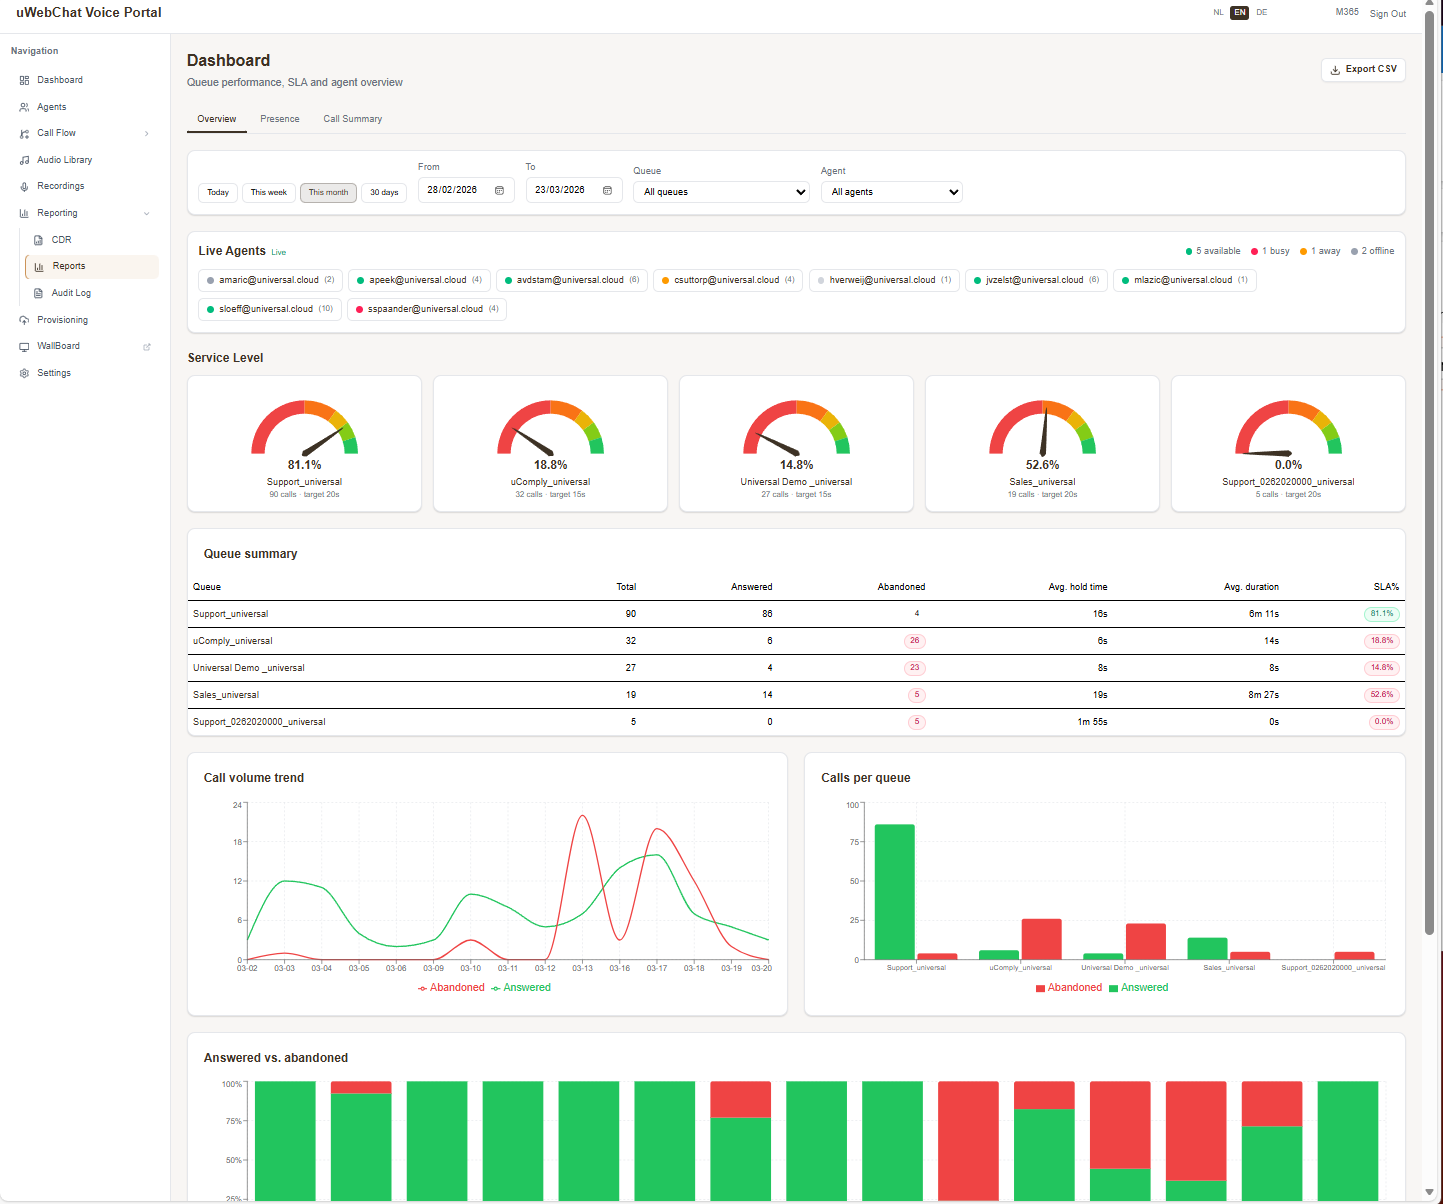
- SLA gauges per queue (clickable for detail)
- Queue Summary table — answered / abandoned / average wait time
- Call Volume Chart — trend line over the period
- Calls Per Queue Chart — pie/donut
- Answered vs. Abandoned Chart — comparison
- Agent Summary table — efficiency metrics per agent
The Export CSV button in the top right downloads all raw data of the current selection.
8.2.4 "Presence" tab
Shows a timeline per agent: when Available / Busy / Away / Offline. Use this for:
- Staffing analysis
- Overtime / break monitoring
- Roster validation
Source: the uWebChat Voice presence database, with several months retention.
8.2.5 "Call Summary" tab
Detail per call: routing through IVR, to which queue, which agent picked up, how long it took. Click a row for a call flow timeline that shows every transfer and wait period.
Pitfalls
- Empty chart after filter — chosen queue/agent had no calls in the period.
- SLA gauge "—" — no target configured. Set the SLA goal via queue detail (§5.1.3).
- Export missing rows — limit is 100,000 rows per export. Pick a shorter period.
- "Call Summary" tab missing — you're missing
UWEBCHATVOICE.CDR.VIEW.