Purpose
The dashboard gives you a real-time overview of your call center: how many queues you have, how many agents, how many closing days, and (with the right permissions) SLA gauges and agent presence.
Required permissions: UWEBCHATVOICE.ACCESS (basic view), UWEBCHATVOICE.REPORTING.VIEW (extended statistics).
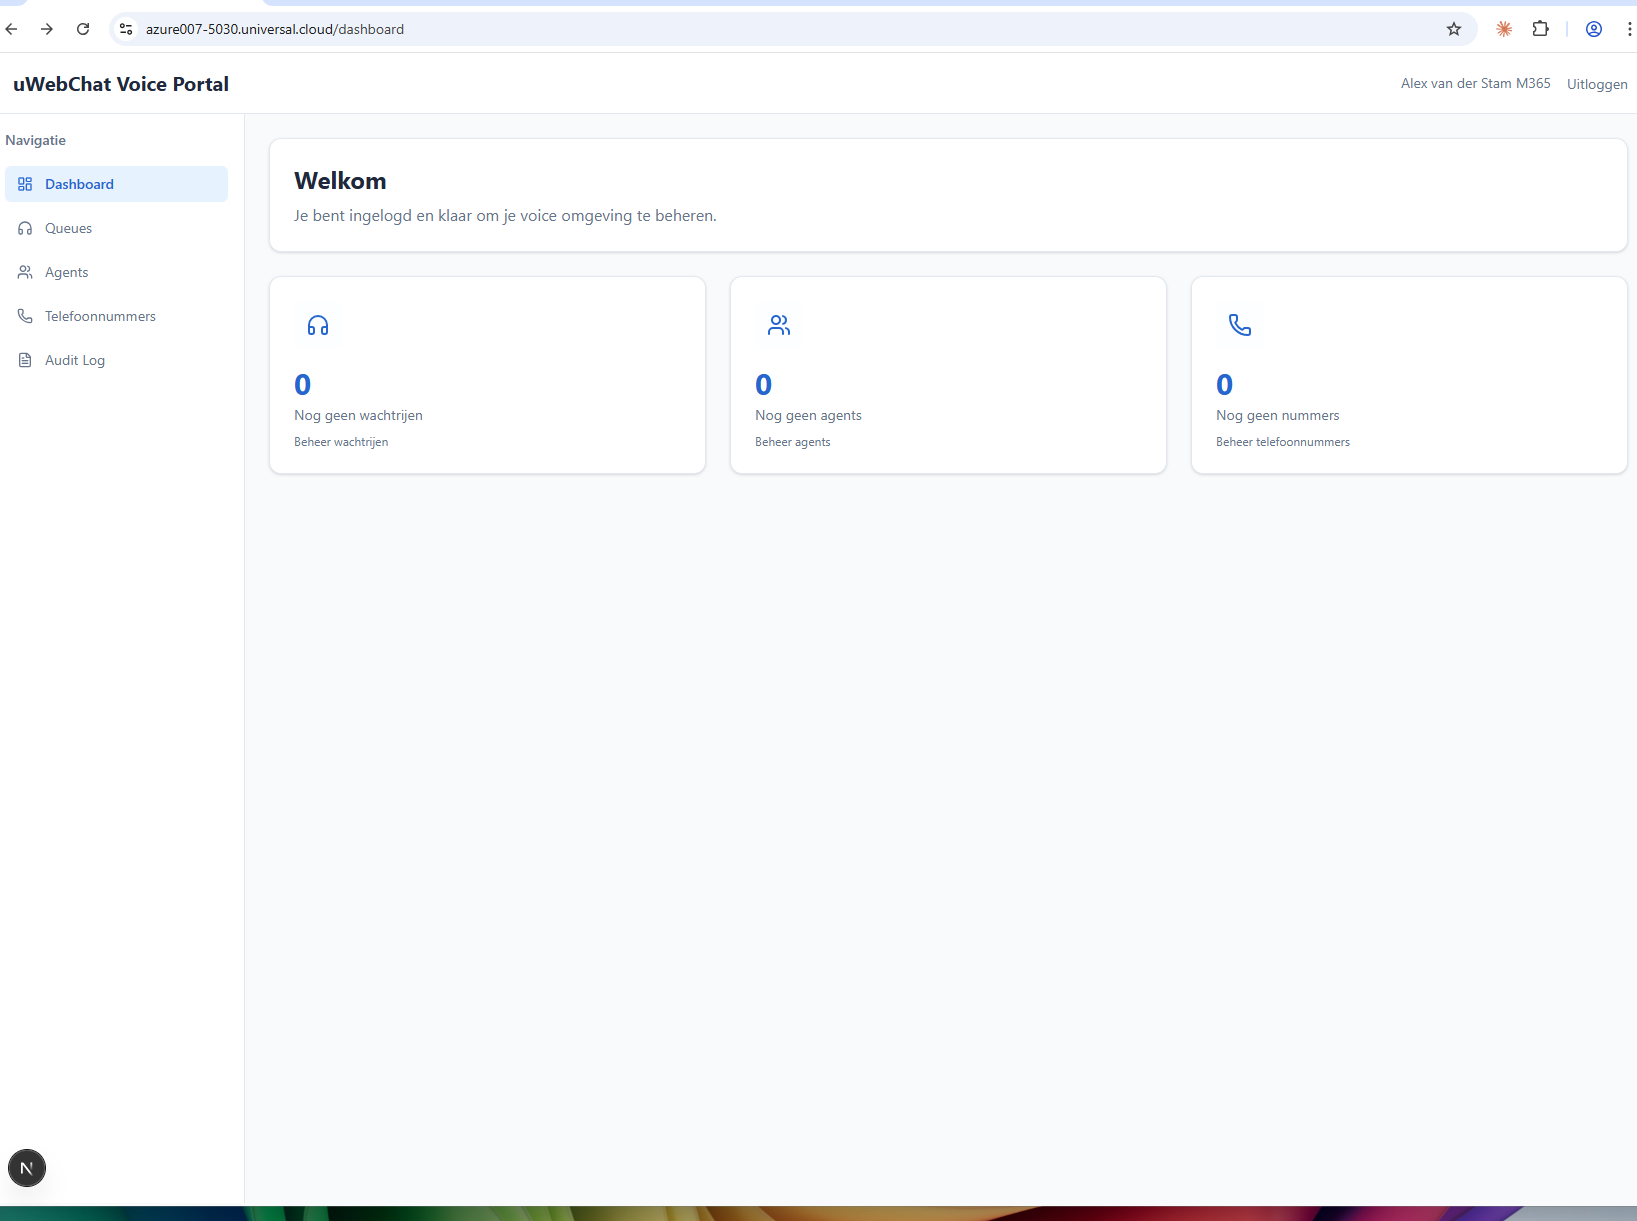
Layout
The dashboard shows management cards for the main modules:
- Call Queues — number of queues, link to §5.1
- Agents — number of agents, link to §4
- Holidays — number of closing days, link to §5.3
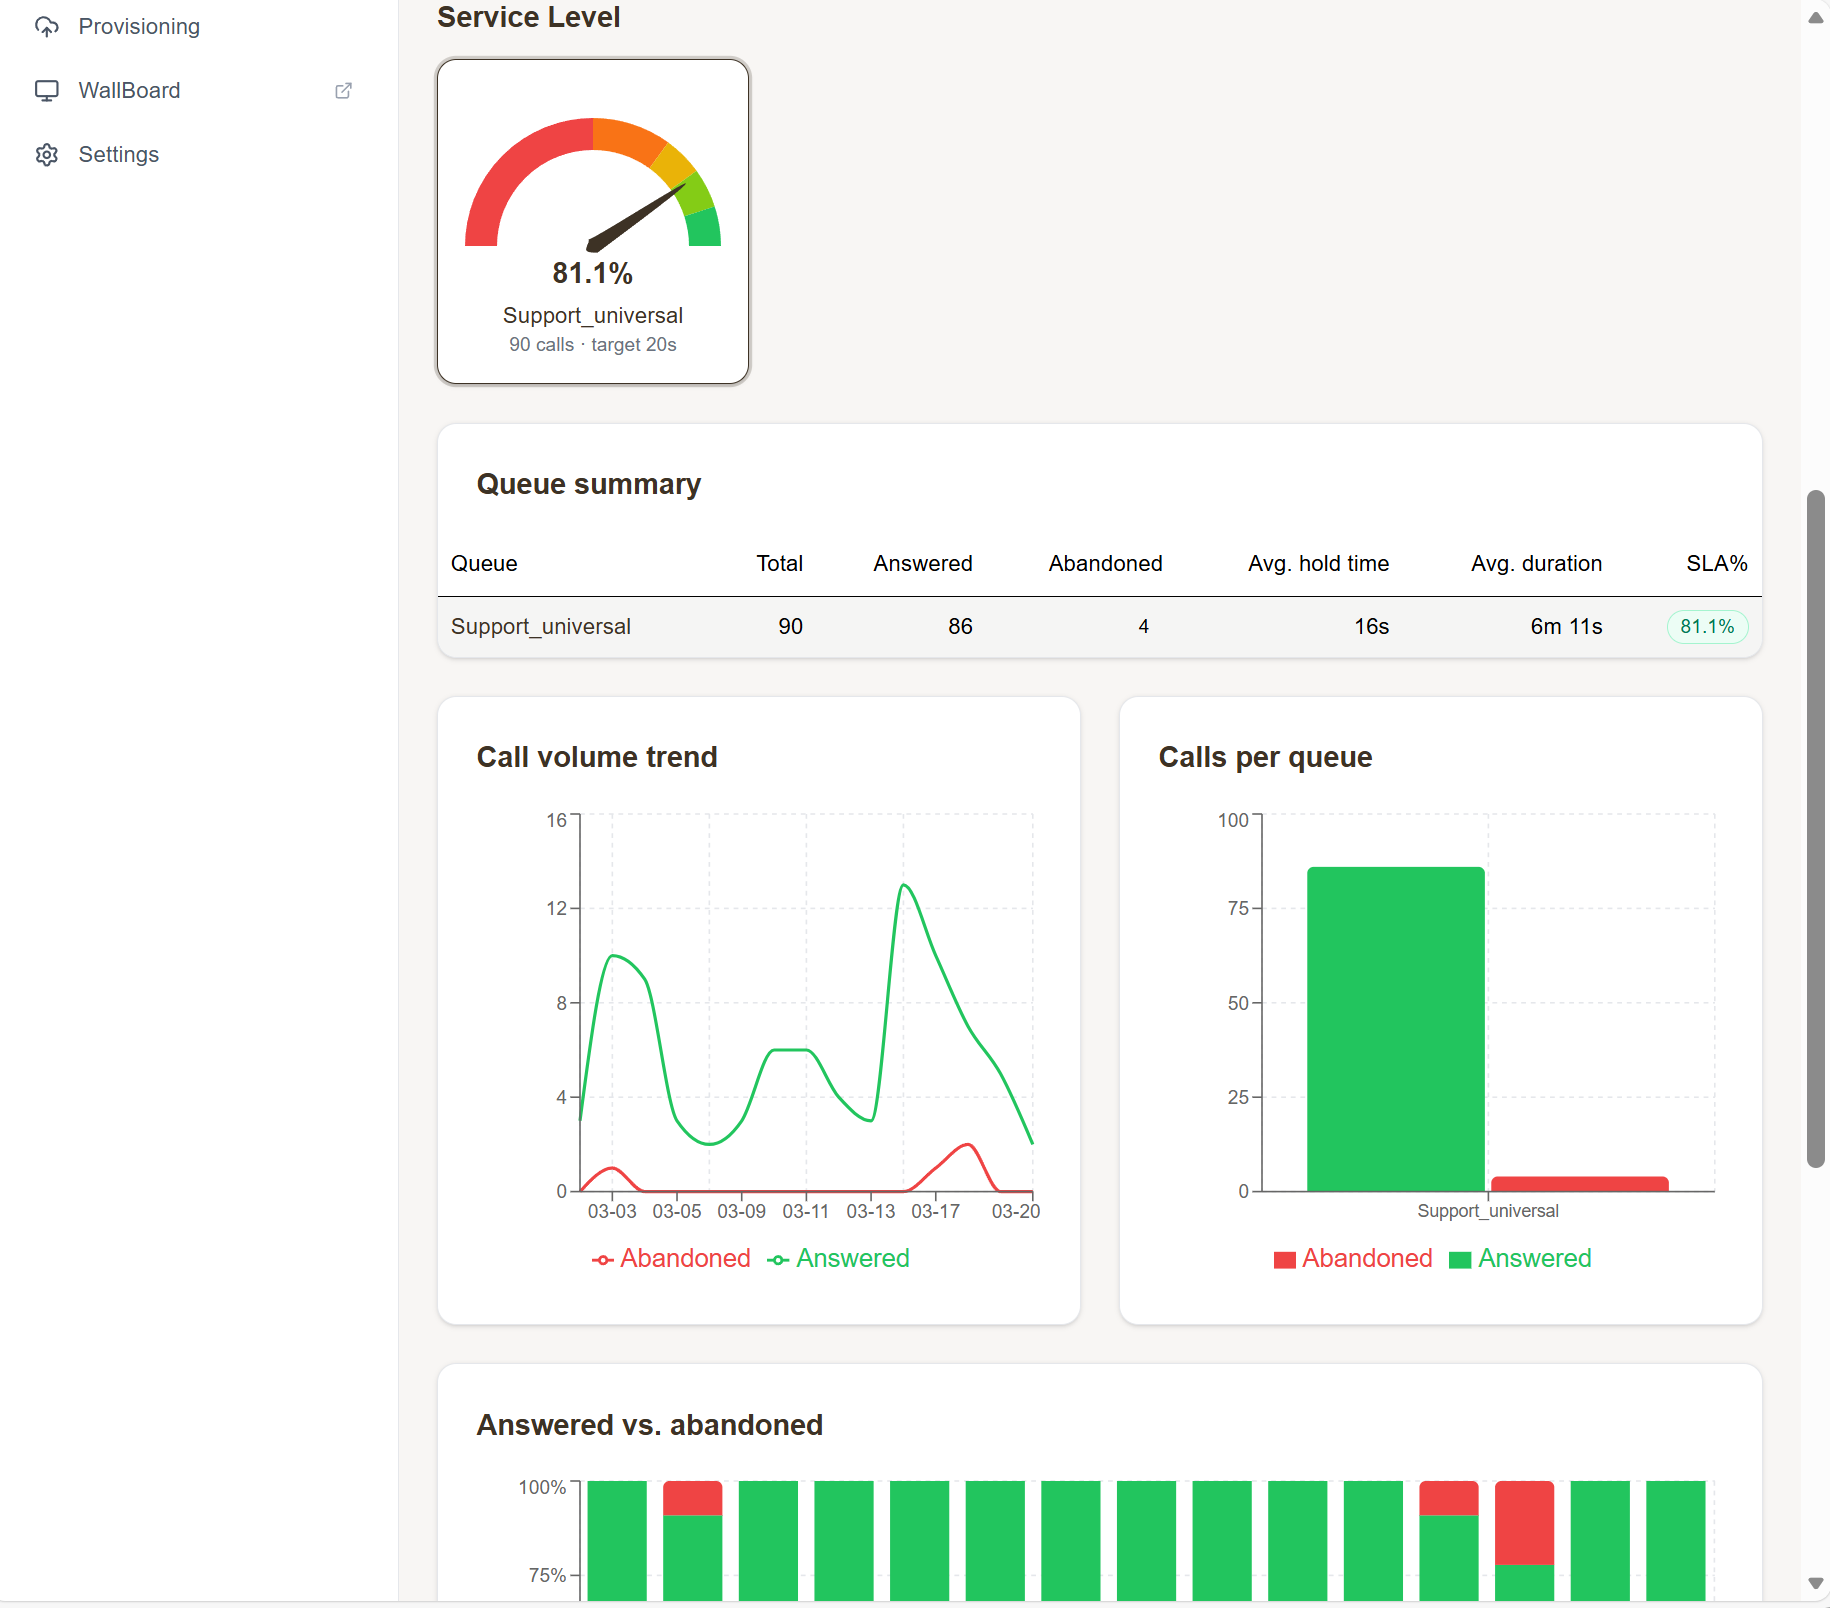
SLA and drill-down (extended view)
With the right permissions you also see:
- SLA gauges per queue (for example: 80% answered within 20 seconds)
- Presence history — agent availability over the selected period
- Drill-down filters — pick a queue and/or agent and all widgets adapt
- Date range presets — Today, This week, This month, Custom
Empty state
Has your tenant not configured any queues yet? Then you see an explanation with a button to create your first queue:
Tips
- The date presets are cumulative: an active "Today" button is highlighted in yellow.
- Click an SLA gauge to jump straight to the queue detail page.
- Empty chart? Check whether the chosen date range actually contains calls (see §8.1 CDR for a quick check).